Overview
I am a year 2 Computer Science Student studying at National University of Singapore. I am interested in using technology to solve everyday problems and am always on the lookout for any challenging project to work with. This portfolio page serves to document my work on FoodZoom.
Project: FoodZoom
FoodZoom is a desktop application allowing users to streamline their delivery process. The application is specifically targeted towards food businesses who need an efficient way to manage their delivery services. FoodZoom uses a Command-Line Interface, meaning users can simply make use of keyword based commands when running the application. The application was built by a team of 5 students including myself.
FoodZoom’s core functionality includes:
-
Users being able to track food orders (visualise on a map) they have from customers
-
Managing deliverymen and assigning orders to them
-
Analysis of orders to display relevant statistics (order history, trending food etc.) to users
Summary of Contributions
The below sections showcase some of the contributions that I made to this application. |
-
Major enhancement: Built the system that allows for the generation of statistics and location-based matching based off the provided data (Pull Request #102, #121)
-
What it does: The main screen consists of a map and a dashboard. The map is able to show the number of pending orders at a region. The dashboard shows statistics like the most popular food item and the order history
-
Justification: Users of this application can track where their pending orders are in one glance. Orders in the same region can now be dispatched to the same deliveryman. Users can also use the generated statistics to improve their profits and improve the overall experience they can provide to their customers
-
-
Major enhancement: Completely revamped and redesigned the User Interface (UI) for the application (Pull Request #73, #128, #171 #183)
-
What it does: Users of this application have a visually appealing interface. They are able to view the status of their orders, available deliverymen and key insights for their data all in one screen.
-
Justification: The UI is minimalistic and was designed with the end-user in mind. There is only one screen that the user uses at all times and all essential details are on that screen. The UI updates itself based on the actions of the user e.g. the map/dashboard will dynamically update when there is a change.
-
-
Minor enhancements:
-
Code contributions: RepoSense
-
Other contributions:
-
Project management:
-
Initiated launch of new features (dashboard/improved find etc.)
-
Guided team members on existing practices
-
Helped with the issue tracking using labels and assignees on Github.
-
-
Documentation:
-
Updated User Guide and Developer Guide for the features I added
-
-
Community:
-
Contributions to User Guide
Given below are some of my contributions to the User Guide. They highlight my ability to write clear documentation targeting end-users. |
Return to Home Page : /home [Since v1.3]
If any selection is done, allows you to return back to the home page with the dashboard
Format: /home
Once the command is executed, you will be greeted with a screen similar to below (statistics shown will vary based on the data you have):
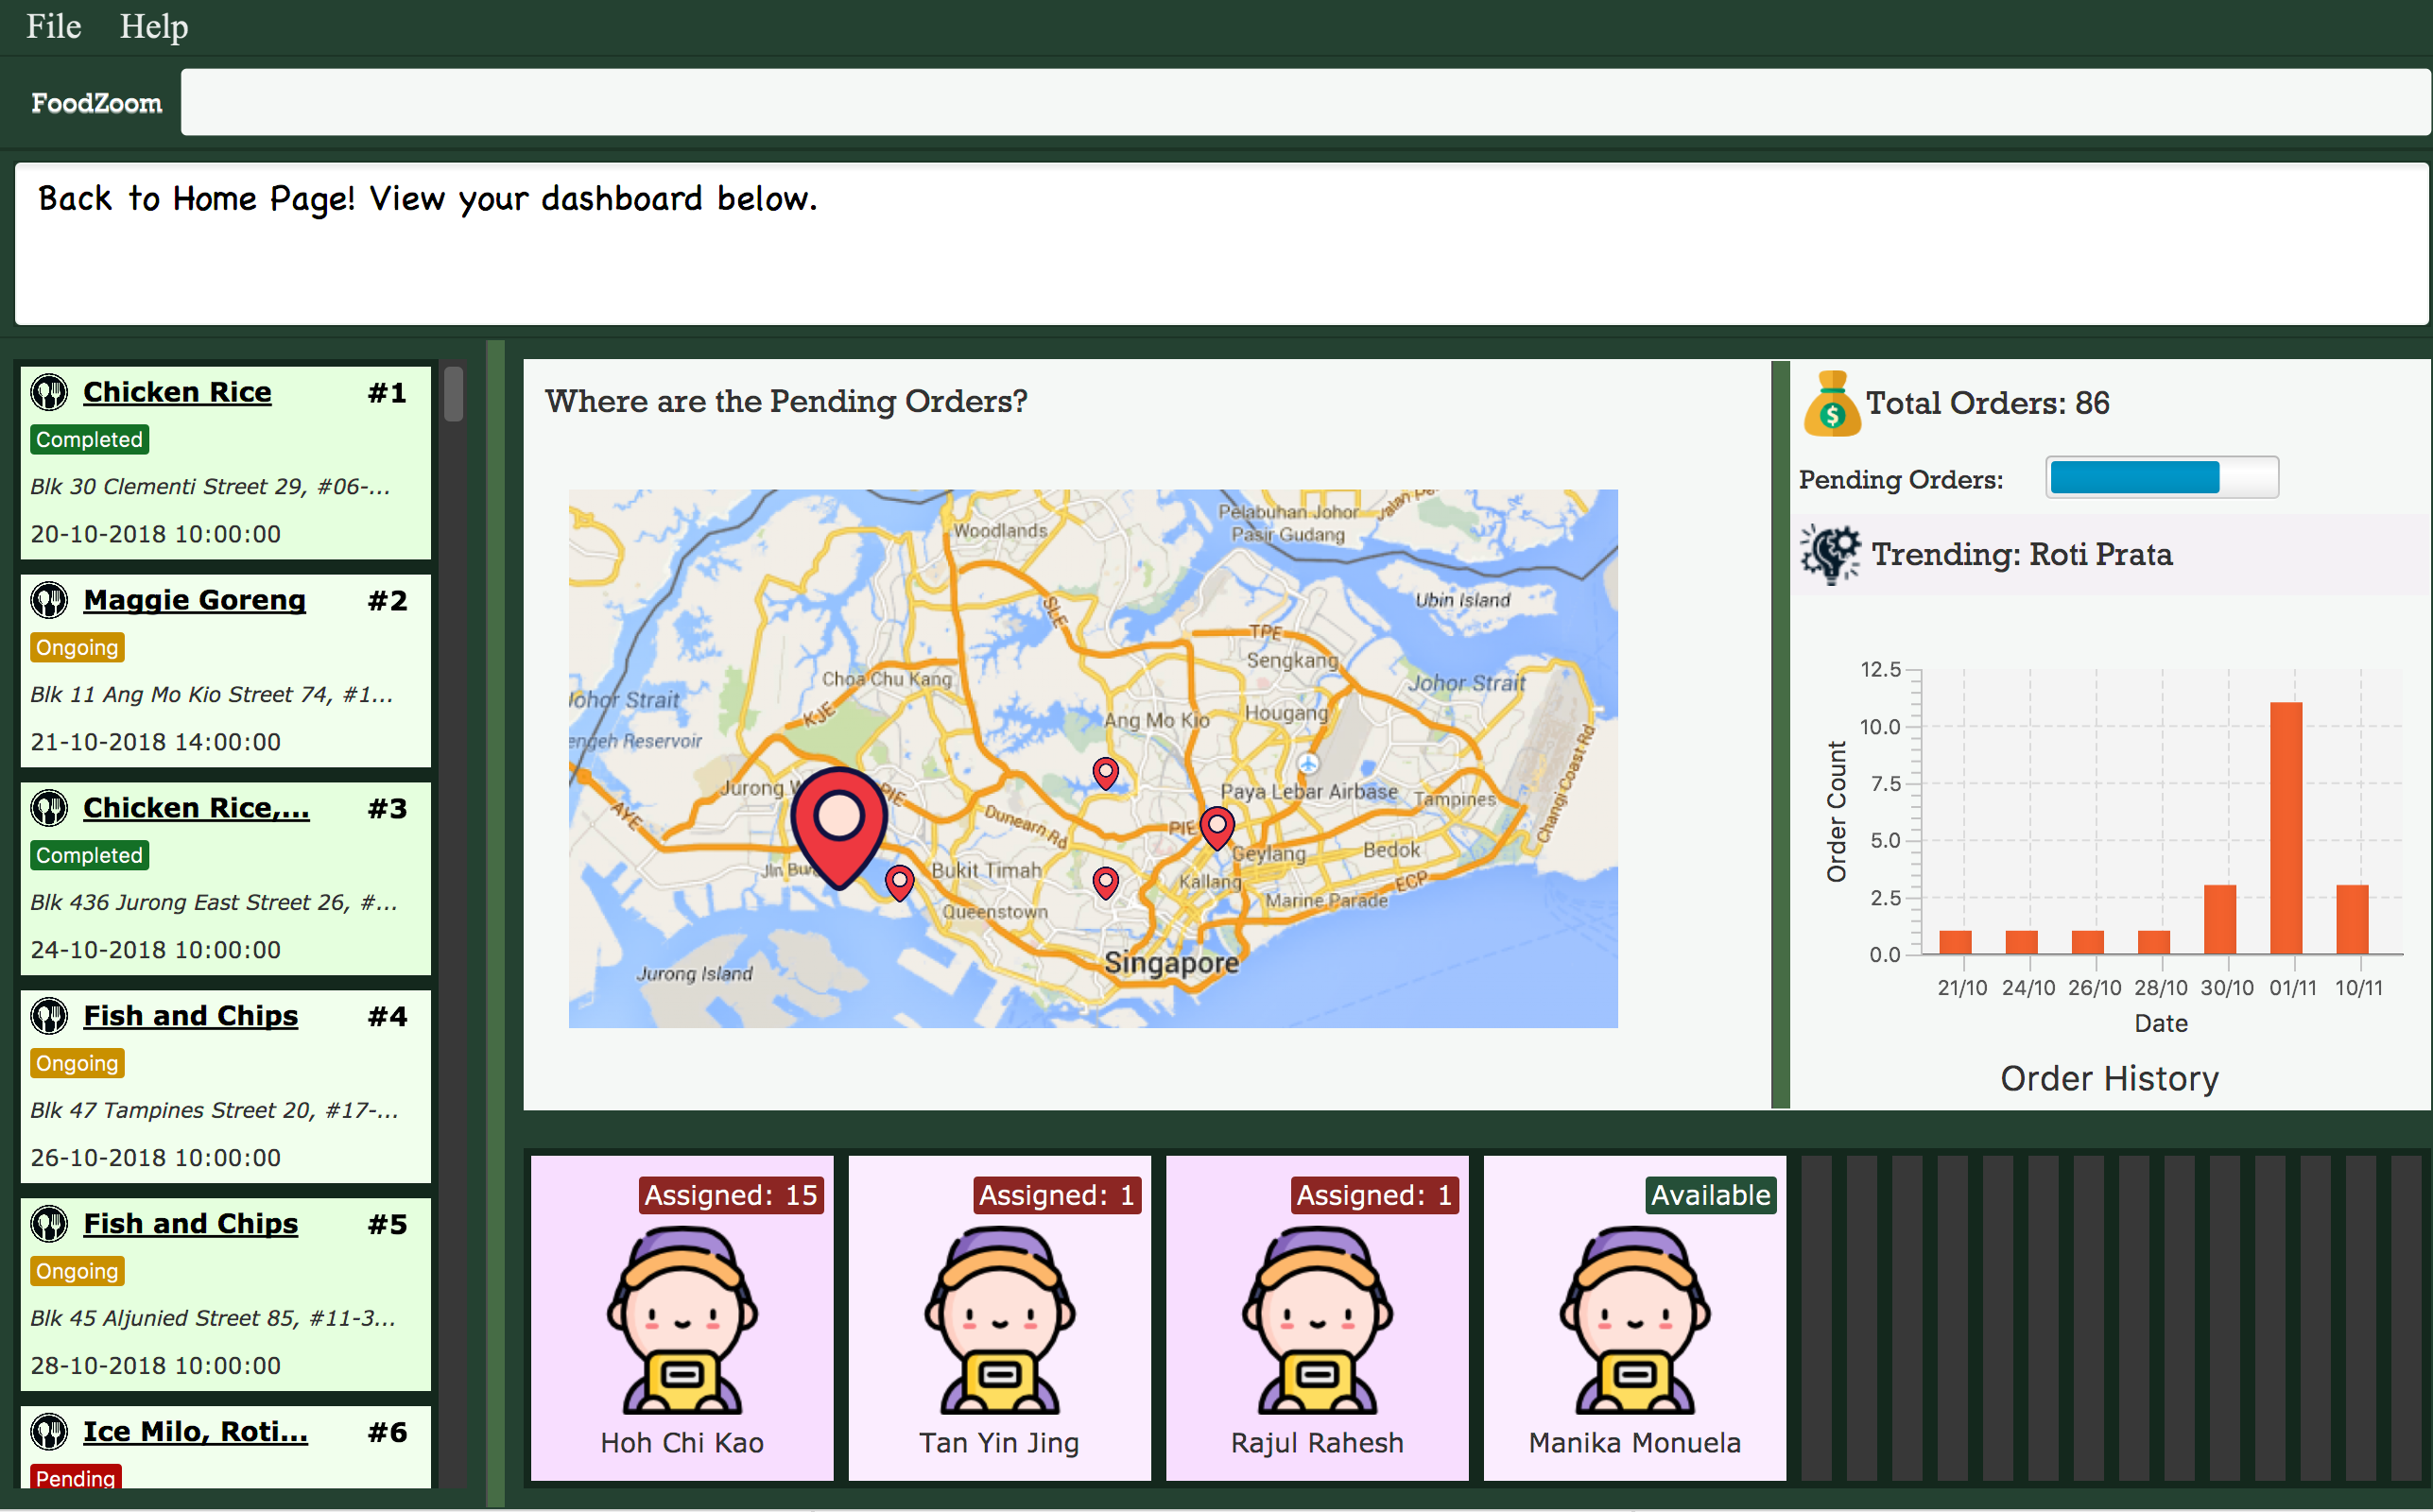
The screen consists of a map showing your pending orders and a statistics panel. The size of the
placeholder is indicative of how many orders they are in a region. You can observe these
components change when carrying out some of the other commands in the application! (try /order find)
This feature allows you to keep track of how many orders you have on certain days and also take note of what is the most common item people have ordered from your stall!
Adding an order : /order add [Since v1.1]
Allows you to adds a new order to the list of orders.
Format: /order add f/FOOD n/NAME p/PHONE a/ADDRESS dt/DATETIME
There are also some things you need to take note of:
Examples of add order commands (note that the above parameters can be re-ordered):
-
/order add f/Roti Prata n/John Smith p/12345678 a/block 123, Clementi Drive, #01-01 610123 dt/26-12-2018 10:10:54 -
/order add a/block 55 Computing Drive 117417 n/Harry f/Tissue Prata f/Nasi Briyani p/81889111 dt/14-12-2018 14:10:54
Contributions to Developer Guide
Given below are some of my contributions to the Developer Guide. They showcase my ability to write technical documentation and the technical depth of my contributions to the project. |
Dashboard
Current Implementation
The dashboard for this application is the main screen that the user first sees when he or she logs into the application. It looks like this:
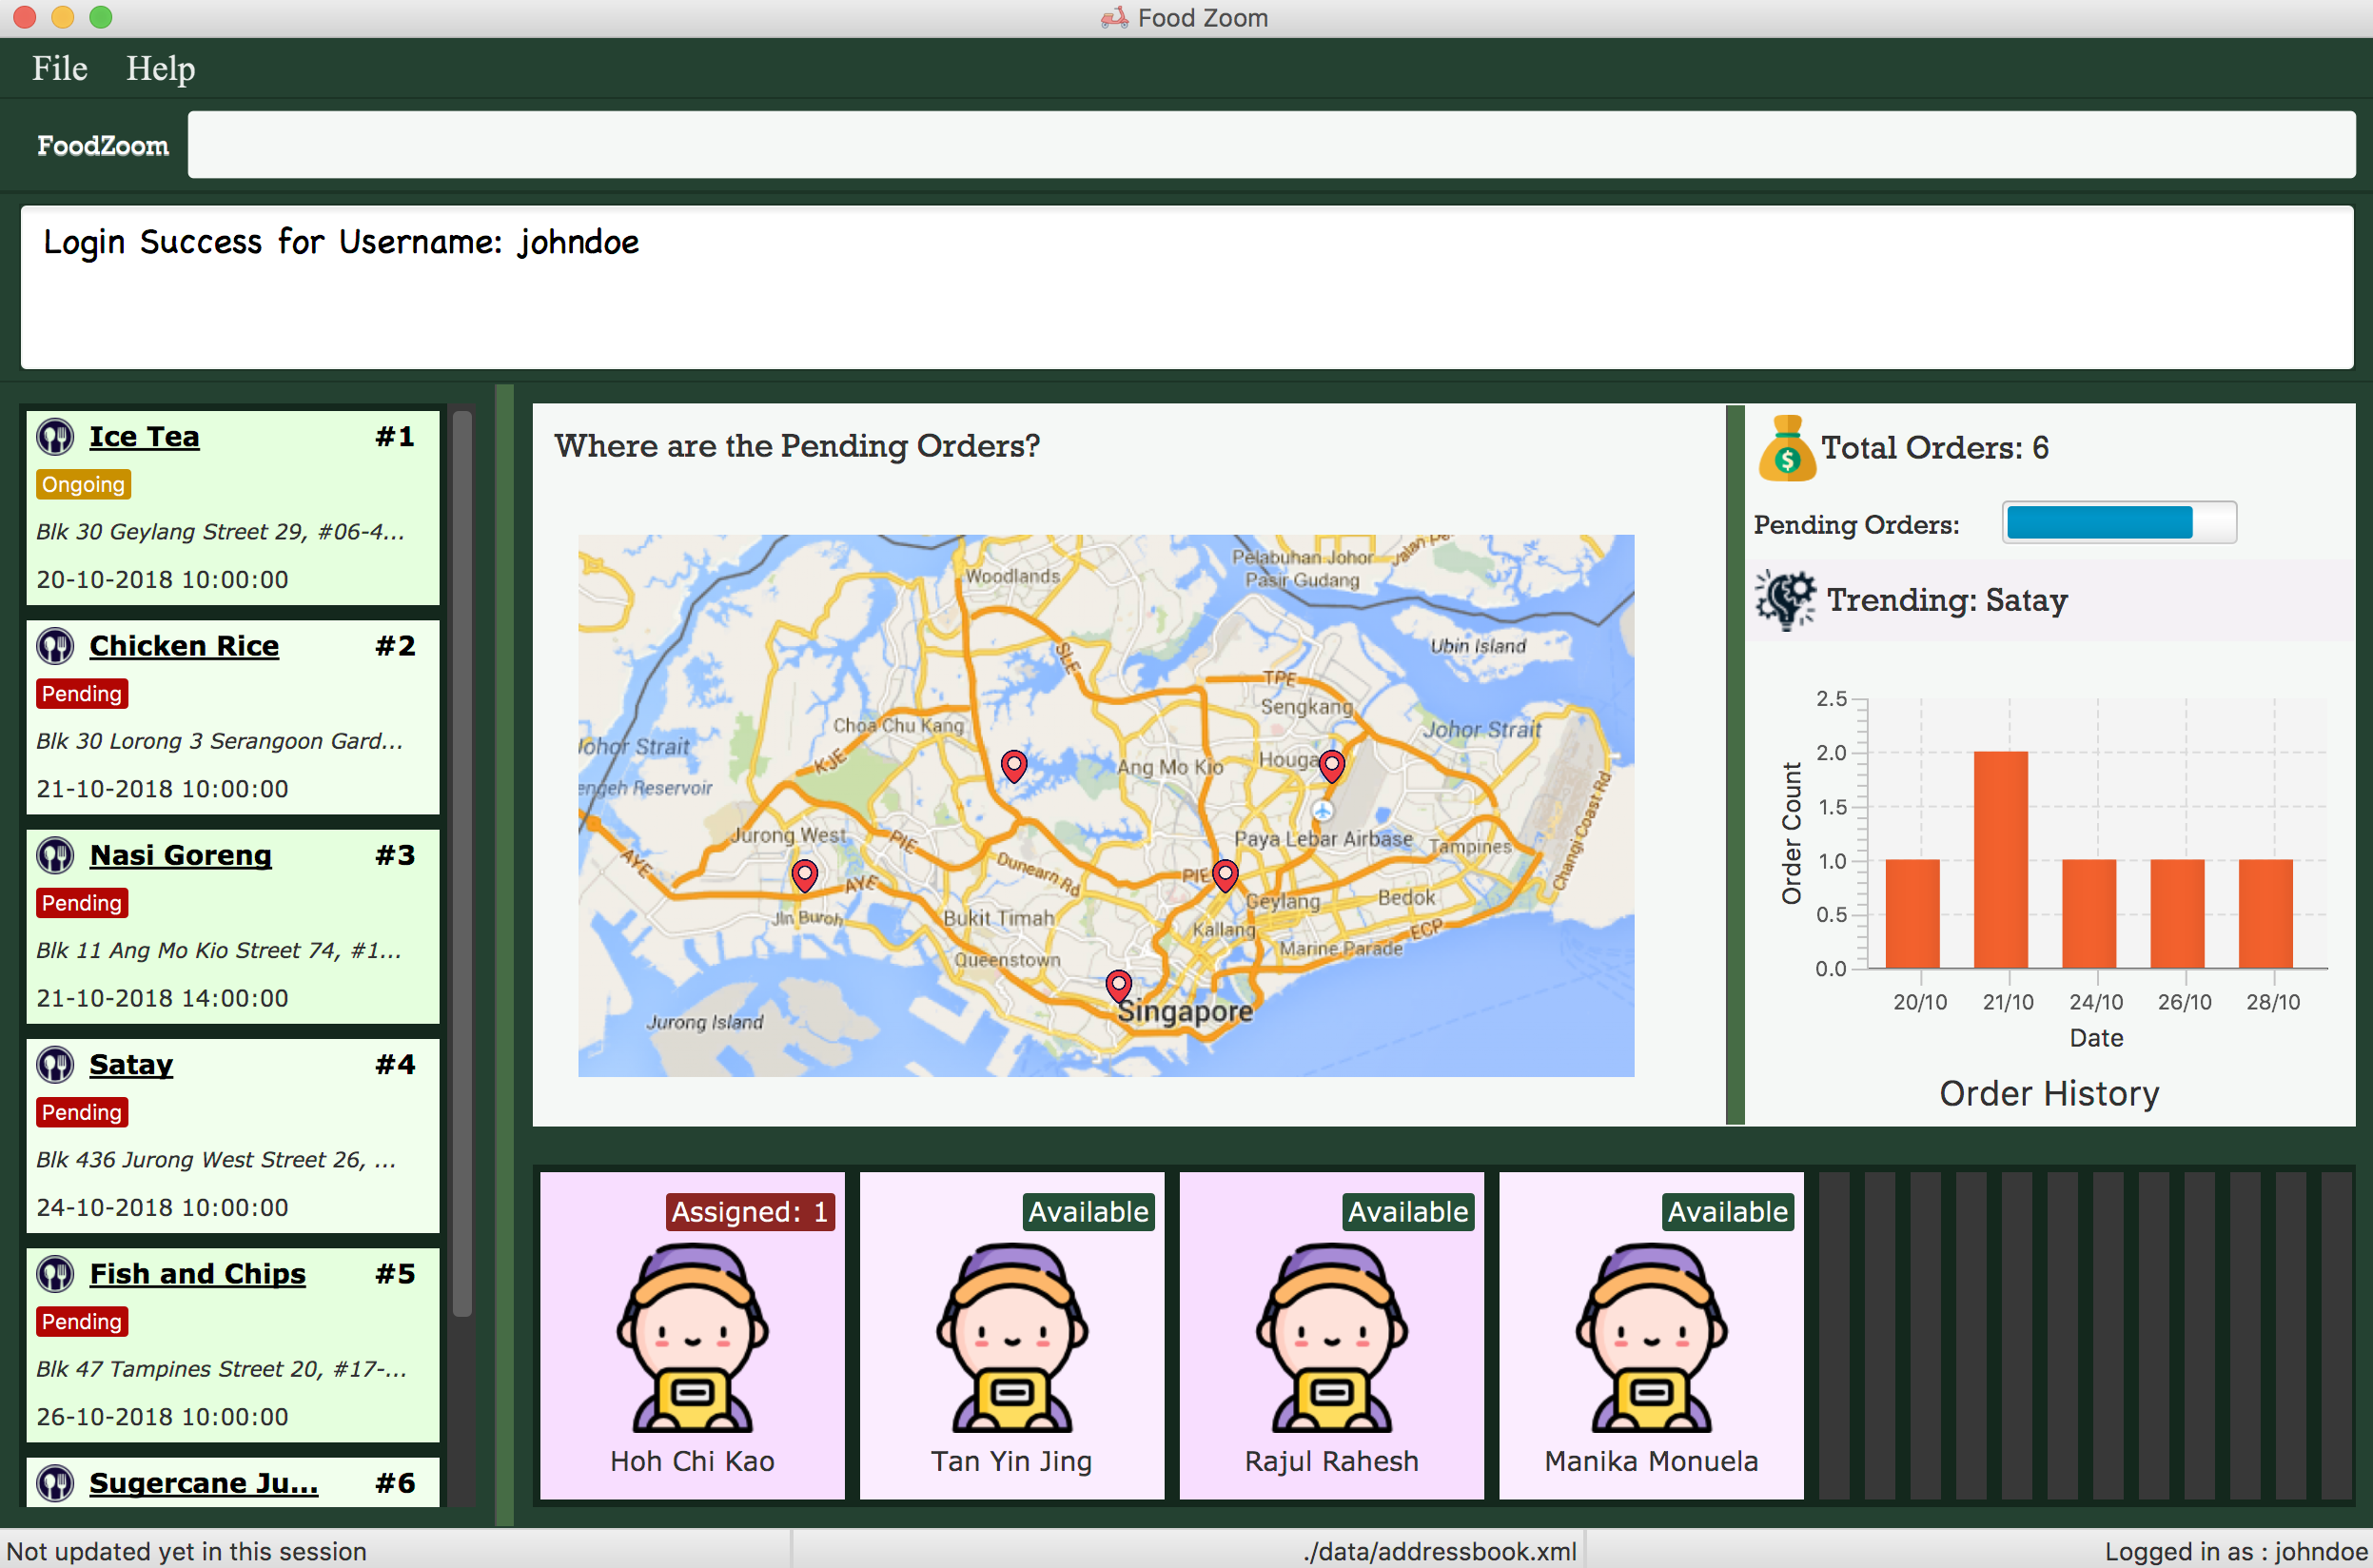
Figure 3.2.1.1 Main Screen showing the dashboard with the Map and Statistics Panel
The 2 main components in the dashboard are the:
-
Map showing location of pending orders
-
Statistics Panel giving insights for the data
Before delving into the details for these specific components, it is important to consider some of the implementation details that are common to both.
The dashboard dynamically updates itself when the order list has been changed. For example,
if /order find n/john is executed, the dashboard will also show orders that are specific
to john.
This is done by using the observer pattern. A higher-level component, Display.java listens for
changes and renders the user interface for the dashboard screen. This component attaches
a listener to the Observable List of Orders. The following activity diagram summarize
what happens inside the Display Component when a user executes a new command:
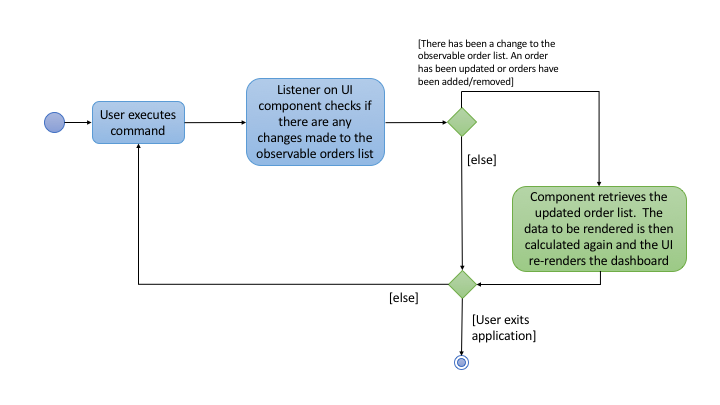
Figure 3.2.1.1 Activity Diagram showing what happens inside the Display component when a user
executes a command
The code snippet for the listener being attached is shown below:
this.orderList.addListener((ListChangeListener.Change<? extends Order> change) -> {
    while (change.next()) {
        if (change.wasUpdated()) {
            // handle order list being updated
            ....
        } else {
            // handle removal or addition to order list
            ....
        }
    }
});
Through this, the Display component is able to control the flow of the dashboard. It is responsible for
rendering the Map and Statistics components along with passing in the data that
they need. The data to be passed in has to be processed into a specific format so that
they can be easily rendered. The next two subsections in 3.2 would elaborate on how this
data processing is done.
Map Component
The Map shows the locations of the pending orders.
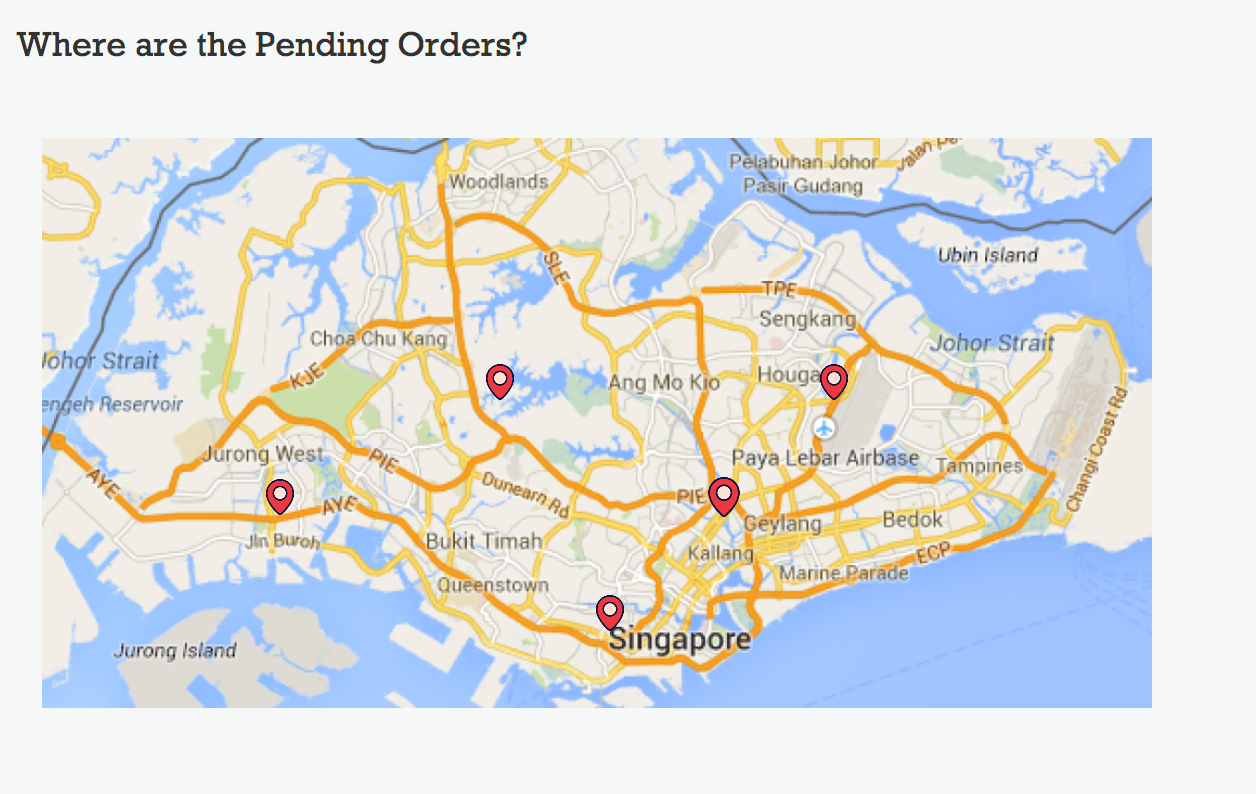
Figure 3.2.2.1 A closer look at the Map on the dashboard.
The functionality that the map provides is as follows:
-
It works offline and does not require internet. There is no reliance on any external service like Google Maps
-
Placeholders are rendered based on the location of Order given
-
The size of the placeholder is indicative of the number of orders in a specific area.
In order to work offline, the map makes use of the postal code that is given with the order address to give a reasonable approximation of its location in Singapore. The reason this can be done is because the first 2 digits of a Singapore postal code refers to a specific district in Singapore. The demarcation diagram is show below:
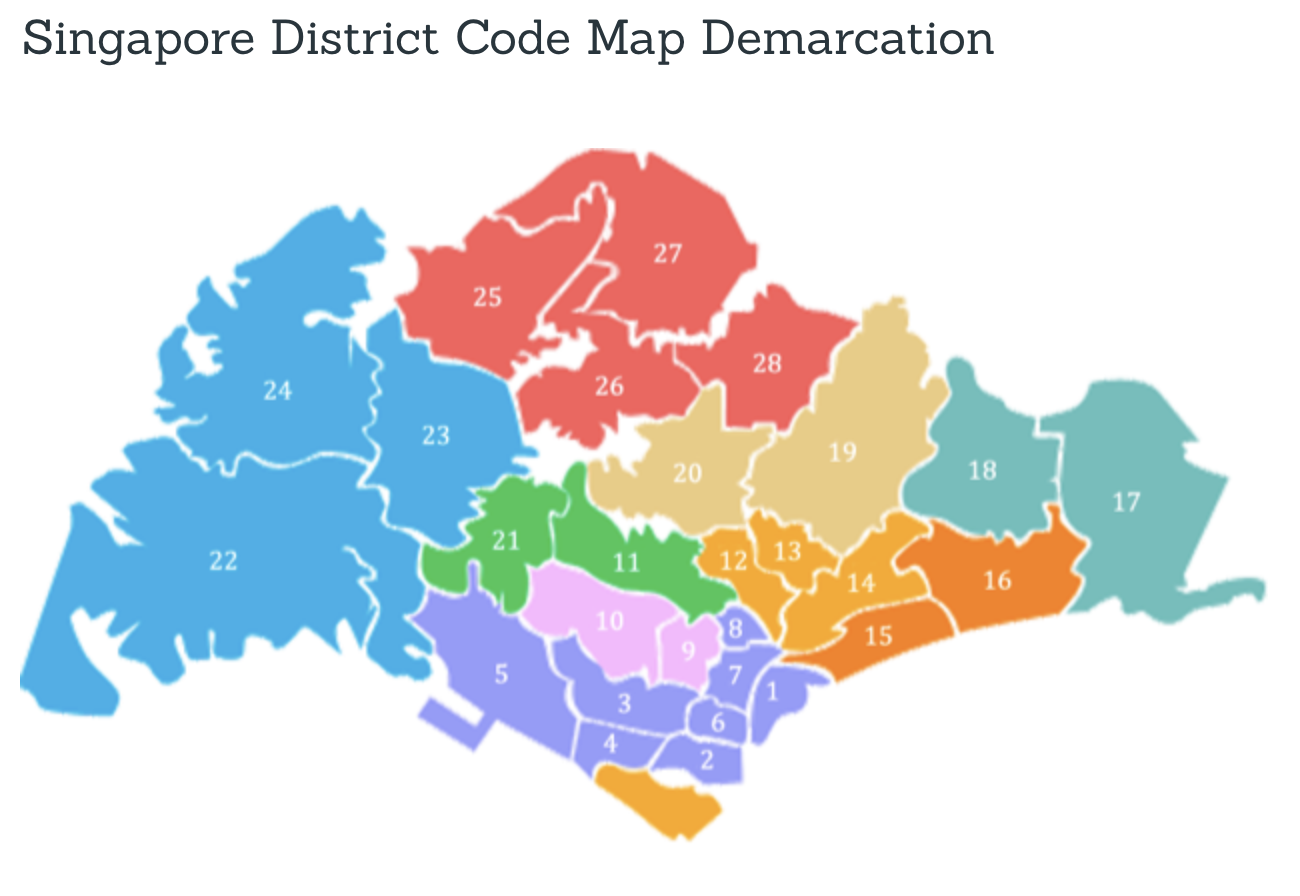
Figure 3.2.1.2 Diagram to illustrate how the regions are split up in Singapore. Each of the regions above corresponds to a specifc postal code tag
For example, if the first 2 digits of the given postal code is "61", the Order falls under district 22 (with reference to the image above). If the first 2 digits are "47", the location is district 16.
Based on this information in order to create an offline map, the components/data structures used are as follows:
An image of a Map that lies on a grid (JavaFx GridPane)
This is the component that displays on the dashboard. This component creates and
updates the placeholders on the map based on the information that it is provided. The component
has no knowledge of changes to the list of orders. Instead, it exposes 2 methods, initialise
and clear that is used by the higher-order component to update the placeholders.
A Hashtable (Java HashMap) that maps the first two digits of the postal
code to a specific coordinate on the grid
As mentioned above, the map is an image that lies on a grid. The placeholders are put onto a specific coordinate specified on the grid. The Map component is thus given a Hash Table of how many orders fall under a specific postal code region. An example data that it could be given is shown below:
| Postal Code Region | Count |
|---|---|
61 |
5 |
16 |
1 |
32 |
2 |
Using this information, the MapPanel uses another lookup table to find out
which coordinate the placeholder should be put inside. For example, postal code 61, is
to be put inside grid {row: 6, column: 2}. The size of the placeholder is determined
by the count of orders that fall within a specific region.
The job of the Display component is to process the list of Orders into the format shown
in the table above. It then calls specific method on the MapPanel component to allow
for placeholders to be shown on the map. This is how the map is able to show locations
of orders without relying on any internet connection.
Statistics Panel
Another aspect for the dashboard is the statistics panel.
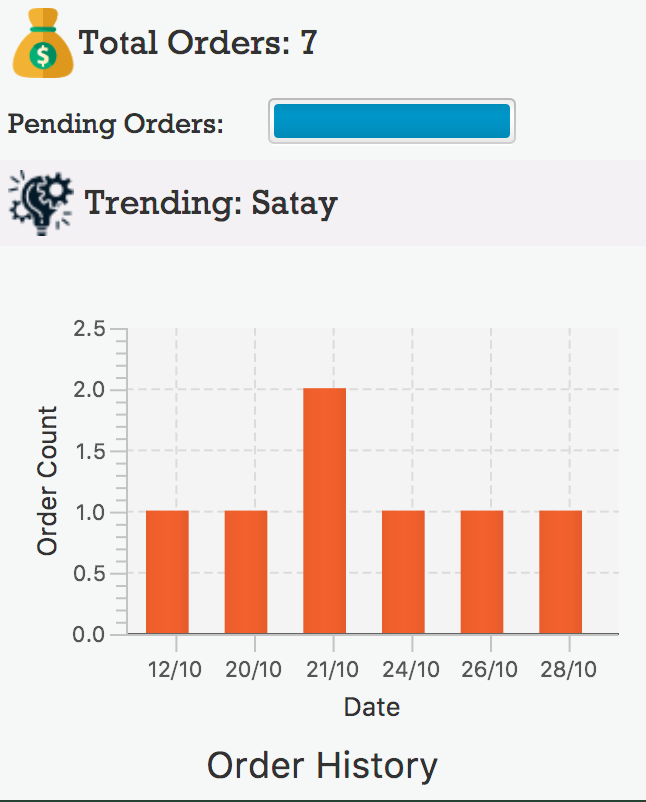
Figure 3.2.3.1 A closer look at the statistics panel in the dashboard
The statistics panel has four key indicators:
-
The total number of orders displayed
-
The percentage of orders that are still pending
-
The most common food item bought
-
The Order History for the last 7 days in which there was at least one order
Similar to the MapPanel, there is a StatisticsPanel which updates these statistics based
on the information that it is provided from a higher-level component. It has similar methods
to the MapPanel that allow data to be initialized and cleared.
The data that is passed in to the StatisticsPanel along with the techniques employed to
process the data is further elaborated on in the table below:
| Statistic | Data Structure | Technique |
|---|---|---|
Total Orders |
Variable |
Count the orders in the list |
Pending Order Percentage |
Variable |
Count orders with status "PENDING" and divide with total orders |
Trending Food Item |
HashTable |
Use a lookup table to track the count of each food item in menu. Each time there is an update ot the orders, run through the table and see which food item has the largest count value. |
Order Histogram |
Balanced Binary Search Tree (Java |
The dates from the Orders are put into a binary search tree along with their count. The tree uses a custom comparator that allows for dates to be compared with each other. This allows the 7 most recent dates with at least one order to be retrieved quickly. The tree is updated accordingly when orders are added or removed. |
Given below are some of the design considerations I had while implementing the dashboard feature. |
Design Considerations (for both Map/Statistics)
Aspect: Processing of data
-
Alternative 1 (Current Approach): Let the UI component handle the processing of data once the listener detects a change
-
Pros:
-
Separation of Concerns: the UI need not rely on other components to update the statistics once a change has been detected.
-
-
Cons:
-
There is a lot of code within the UI component itself and this solution is not very scalable. If more statistics are needed in the future, it will be difficult to configure.
-
-
-
Alternative 2 : Create a Statistics Manager under Model
Instead of doing all the processing of data in the UI component itself, one consideration was to use a statistics manager. This manager will take in the list of orders and return the required statistics needed.
-
Pros:
-
This solution is more scalable. By having a separate class dedicated to managing the statistics of orders, it is easier to add in much more complex statistics for the application in future.
-
-
Cons:
-
There is more coupling. The UI has to constantly check with the statistics manager once a change to the observable list is detected.
-
The code becomes much more complex. There also may be a need to re-look at how the entire listener pattern is established.
-
Aspect: Gathering Location Data
-
Alternative 1 (Current Approach): Use a cache to map points based on the first 2 digits of postal code
-
Pros:
-
The application would work offline.
-
There is no reliance on an external API service for the application to function. If the API service fails to function at any point of time, the map may not work anymore.
-
-
Cons:
-
There are inaccuracies in the data that is displayed on the map. It is also not very precise. e.g. You cannot zoom into the map and locate where exactly the orders are.
-
-
-
Alternative 2 : Make use of an external API service like Google Maps to render the location placeholders on the map
-
Pros:
-
The location data would be much more accurate and precise. Locations can be mapped exactly as they are. Relying on a powerful service could mean that this map feature can even be extended to work globally (not just Singapore).
-
-
Cons:
-
As mentioned above, there will now be a reliance on this service for this application to work. This would also introduce more overhead to the code e.g there is now a need to check for internet connection and render loaders so that the user experience is not affected.
-
-